Can You Trust Korean Certification Rankings? Check the Data
Before relying on an online ranking of Korean certifications, look up applicant numbers and written and practical pass rates on Q-Net yourself. Here is how to read them.
 Hannah Price
In this post
As of October 2026, the short answer is that online rankings of Korean certifications are a starting point, not a verdict. For Korea's national technical qualifications, the official exam statistics are public: Q-Net, the qualification portal run by HRD Korea (Human Resources Development Service of Korea), shows year-by-year applicant numbers and pass rates for each qualification, split into the written exam and the practical exam. Checking which year a ranking used, and whether it quoted written or practical figures, often changes what the ranking actually means.
This guide walks through two real Q-Net tables, the Engineer Information Processing statistics (정보처리기사) and the Engineer Industrial Safety statistics (산업안전기사), to show what applicant counts and pass rates can and cannot tell you about popularity and difficulty. It does not recommend a particular certificate. The goal is a repeatable way to test any ranking you come across, whether it appears in a Korean video, a study-group post or an English-language blog about working in Korea.
Start by asking what a certification ranking is measuring
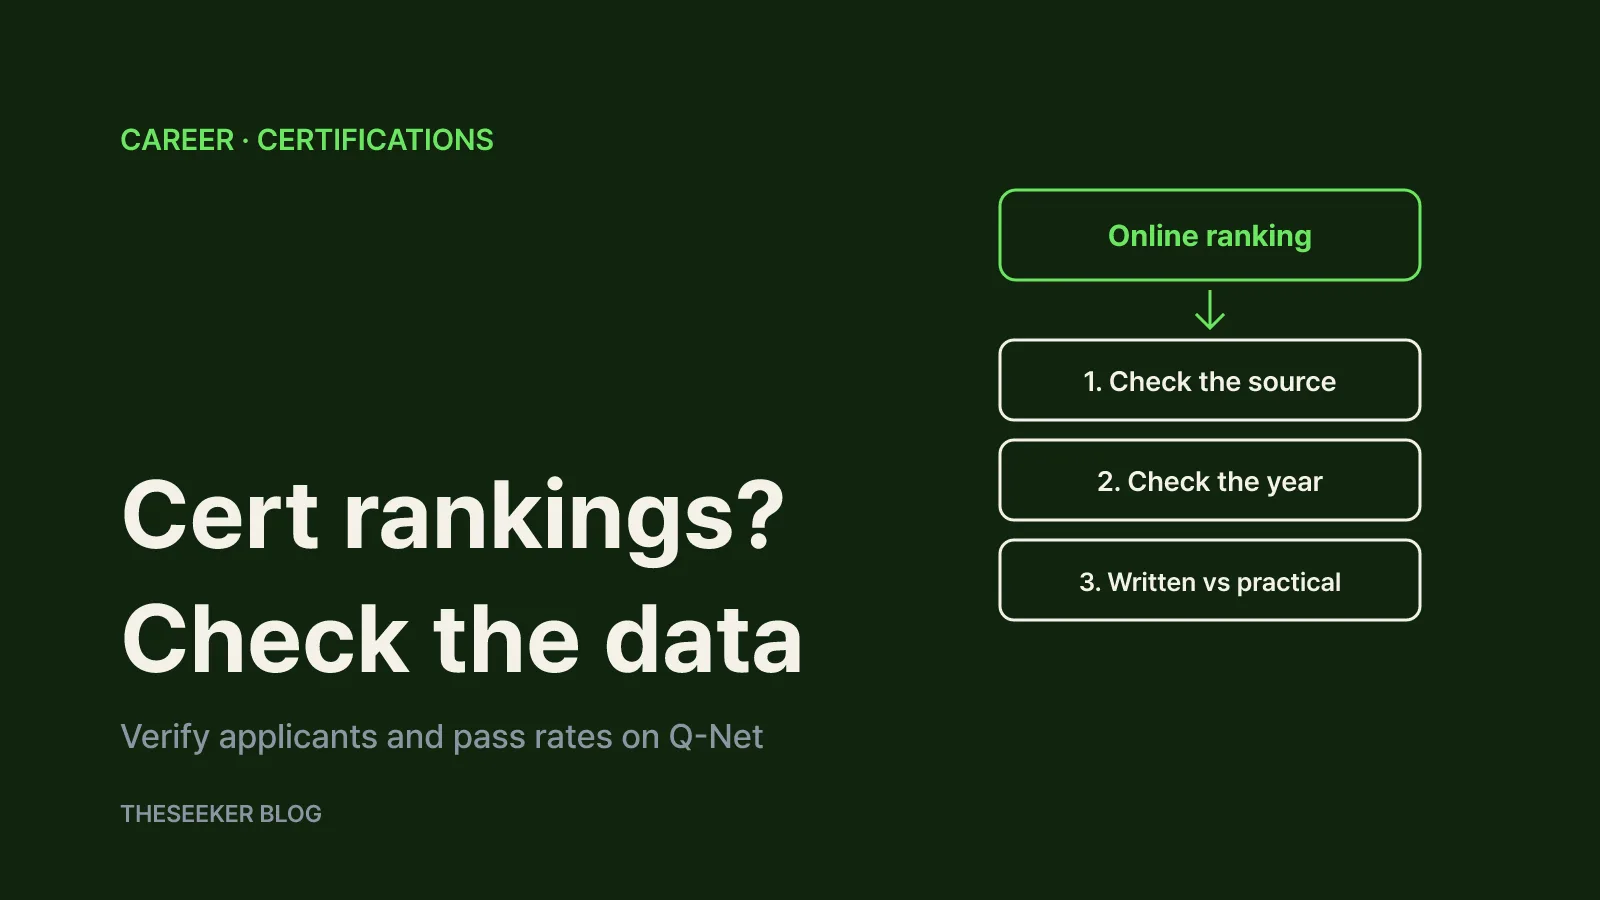
Lists titled "top certifications in Korea" rarely measure the same thing. One list sorts by the number of applicants. Another treats a low pass rate as a "difficulty ranking". A third is simply the author's opinion of what is useful. The word ranking hides very different methods, so before looking at positions, look for three things:
- Source. Does the list say where its numbers came from? For national technical qualifications, the primary source is the issuing body's portal, Q-Net. A figure copied from another blog or a prep school's marketing page is a secondary source at best.
- Year. Is the reference year stated? A list without a year may be recycling figures that are several years old.
- Basis. Is the pass rate for the written exam, the practical exam or some combined figure? For applicant counts, is it written-exam applicants or practical-exam applicants?
A ranking that omits these is not necessarily wrong, but you have no way to check it. A ranking that states them can be verified against the original table in a few minutes.
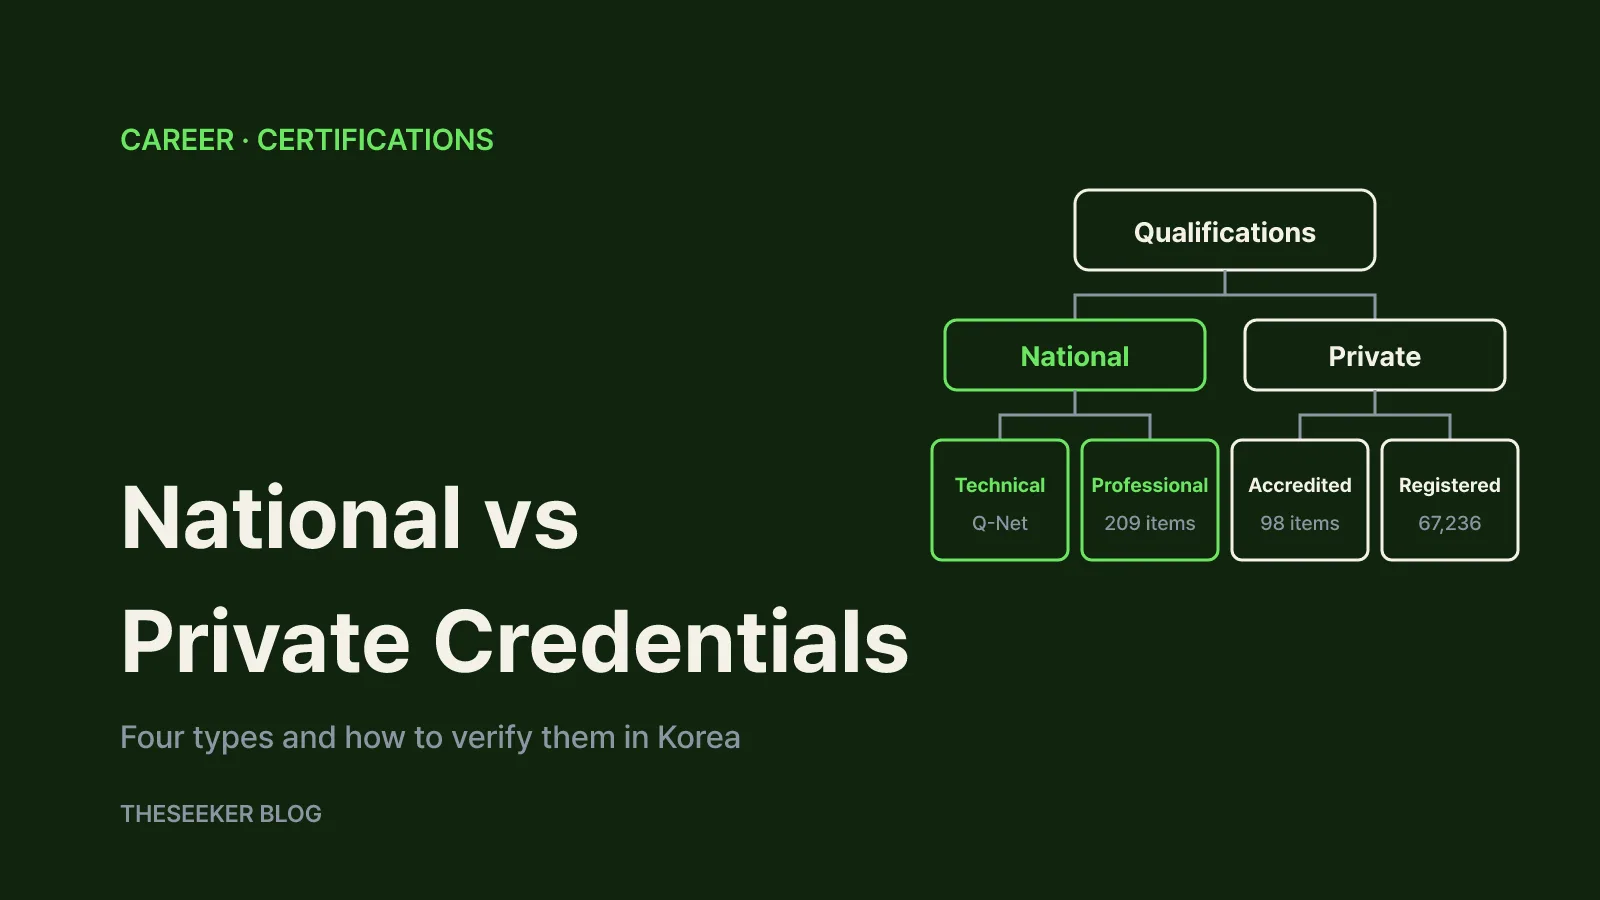
Also check what kinds of credentials are being mixed together. Q-Net lists national qualifications separately from private qualifications, with its own pages on private qualification registration and on nationally accredited private qualifications (Q-Net statistics menu). Putting national and private credentials on one list compares qualifications that are run and reported in different ways. The lookup method below applies to the national technical qualifications whose statistics Q-Net publishes.
How to look up applicant numbers and pass rates on Q-Net
The per-qualification statistics are a few clicks away on Q-Net, which is in Korean:
- Go to 자격정보 (Qualification information) → 국가자격 (National qualifications) → 국가자격 종목별 상세정보 (Details by qualification).
- Choose a job field from the list or search for the qualification by name, then open it.
- On the 기본정보 (Basic information) page, scroll to the 종목별 검정현황 (Examination statistics by qualification) table. Each row is a year, with written-exam applicants, passes and pass rate, followed by the same three figures for the practical exam.
For example, the Engineer Industrial Safety table shows that in 2025, 90,265 people sat the written exam, 40,772 passed and the pass rate was 45.2%. For the practical exam, 46,506 sat, 31,247 passed and the pass rate was 67.2%. The table runs year by year from 2001, groups 1977 to 2000 into one row and ends with a cumulative total.
For comparisons across many qualifications, use the 자격검정통계 (Qualification statistics) menu instead. It contains an overall summary, the National Technical Qualification Statistical Yearbook, candidate trends, regional figures and a link to the national statistics portal (Q-Net Statistical Yearbook). If a ranking claims to cover "the most popular certifications overall", the yearbook and summary pages are a faster check than opening tables one at a time.
A useful habit is to write down the number a ranking quotes and place it next to the Q-Net figure for the same year and the same exam stage. If they match, the ranking used the source correctly. If not, it used a different year, a different stage or made a copying error. In every case, the Q-Net figure is the one to rely on.
Why pass rates can mislead you about difficulty
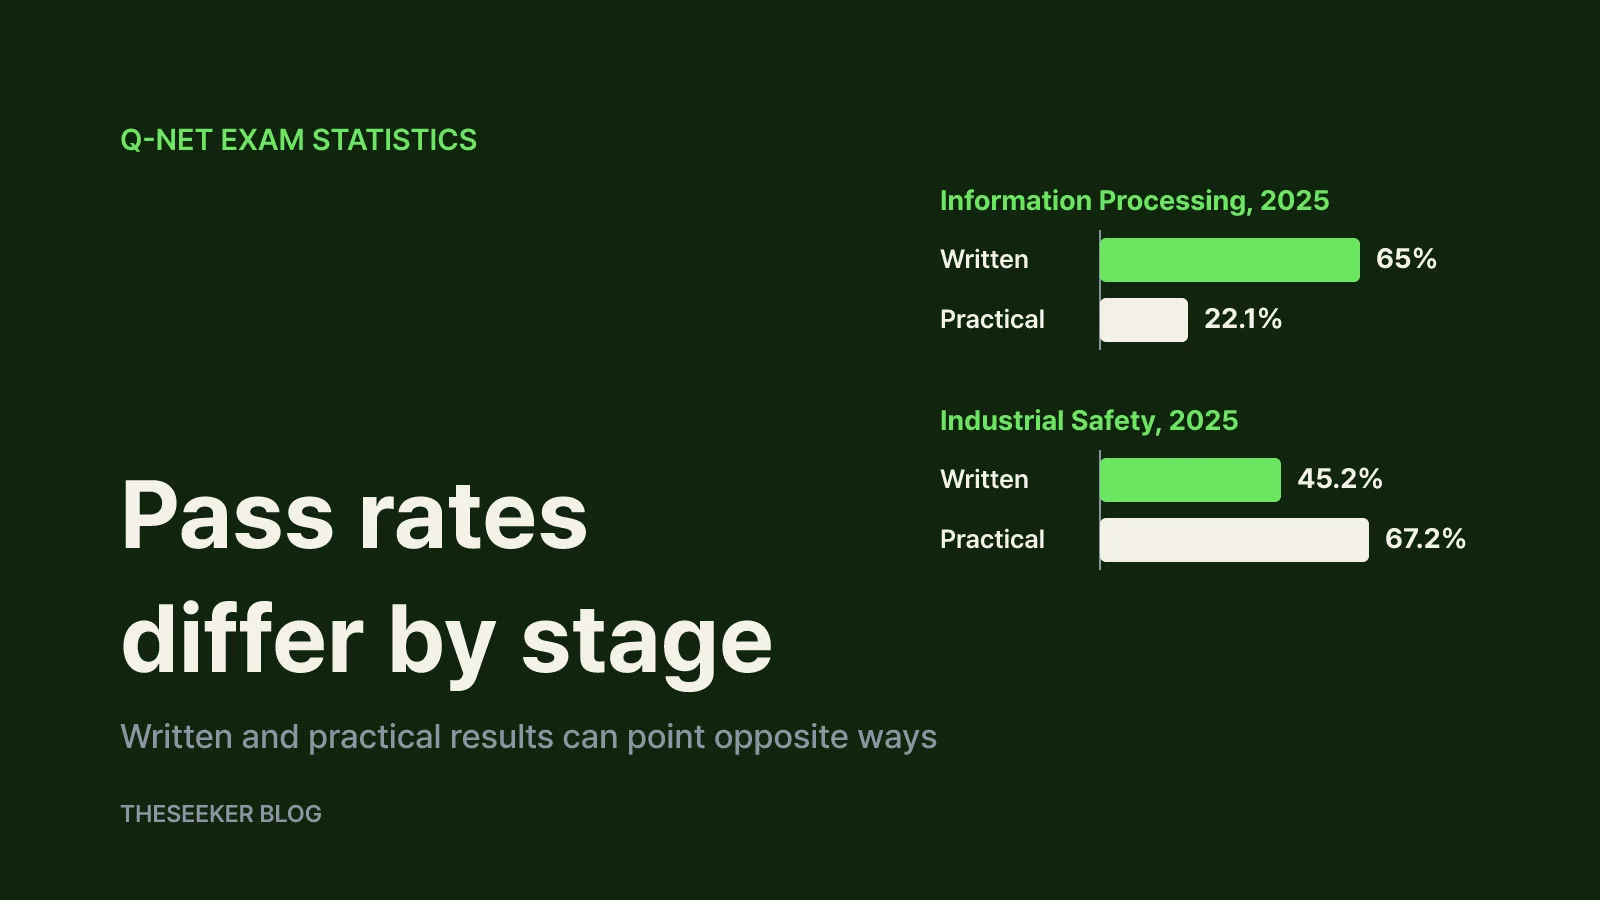
It seems obvious that a low pass rate means a hard exam. The official tables show why that reading is too simple. The first step is to treat the written and practical exams separately.
The Engineer Information Processing table shows a 2025 written pass rate of 65% (66,308 sat, 43,132 passed) but a practical pass rate of 22.1% (73,858 sat, 16,326 passed). A ranking built on the written figure makes it look manageable; one built on the practical figure makes it look brutal. In the same year, Engineer Industrial Safety had the opposite pattern: 45.2% on the written exam and 67.2% on the practical. Reduce either qualification to a single pass rate and that structure disappears.
The second issue is year-to-year swings. The Engineer Information Processing practical pass rate was 51.4% in 2019, 17.7% in 2020, 30.8% in 2021, 20.8% in 2022, 21% in 2023, 28.9% in 2024 and 22.1% in 2025. Quote one year and the same exam can sound either approachable or forbidding. Look at several recent years and note whether one year is an outlier or the level is consistent.
The third issue is who is sitting the exam. A pass rate blends the difficulty of the test with how prepared the candidates are. Practical-exam candidates have generally already cleared the written stage, so they are a filtered group. Notice also that in 2025 more people sat the Engineer Information Processing practical exam (73,858) than the written exam (66,308). Practical candidates can include people who passed the written exam earlier and are exempt from retaking it. Q-Net publishes the rules for that exemption period on its own page, so check the exact conditions there.
Read pass rates as a map of where candidates drop out. A low written rate suggests broad theory preparation; a low practical rate suggests leaving plenty of time between the written result and the practical exam.
Do applicant numbers prove popularity?
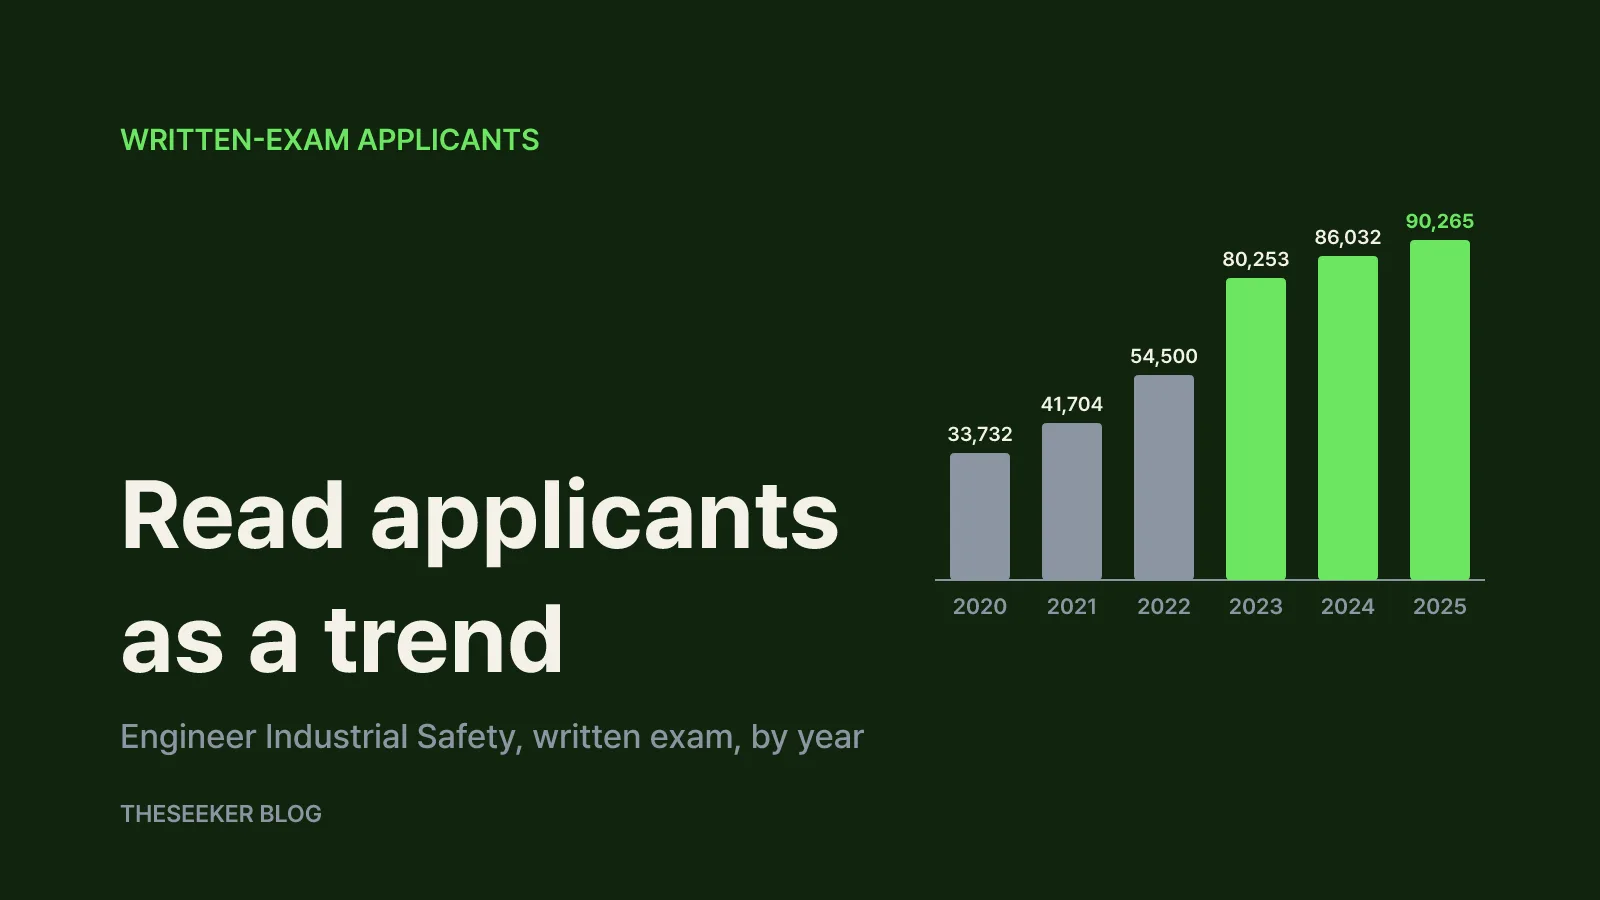
Applicant counts show how many people are taking an exam. That can be useful in itself, since a crowded exam usually has more study materials and more candidate reviews. But a high count does not prove a qualification will help in a particular job, and a single year can hide the trend.
The Engineer Industrial Safety table shows written-exam applicants rising every year: 33,732 in 2020, 41,704 in 2021, 54,500 in 2022, 80,253 in 2023, 86,032 in 2024 and 90,265 in 2025. A trend like that says far more than any single figure. The table does not explain why numbers rose, so look at the relevant regulations or job postings rather than guessing at a cause.
Trends can run the other way too. Engineer Information Processing had 131,062 written-exam applicants in 2006 and 66,308 in 2025, with a cumulative total of 2,069,850 written-exam applicants. When a list calls something "number one by applicants", ask whether it means a single year or a cumulative total, and which year.
Finally, pair applicant numbers with practical-exam passes, which show how many people clear the last hurdle. In 2025, 16,326 people passed the Engineer Information Processing practical exam and 31,247 passed the Engineer Industrial Safety practical exam. Seeing both figures separates how crowded an exam is from how many people actually finish.
A checklist for building your own comparison
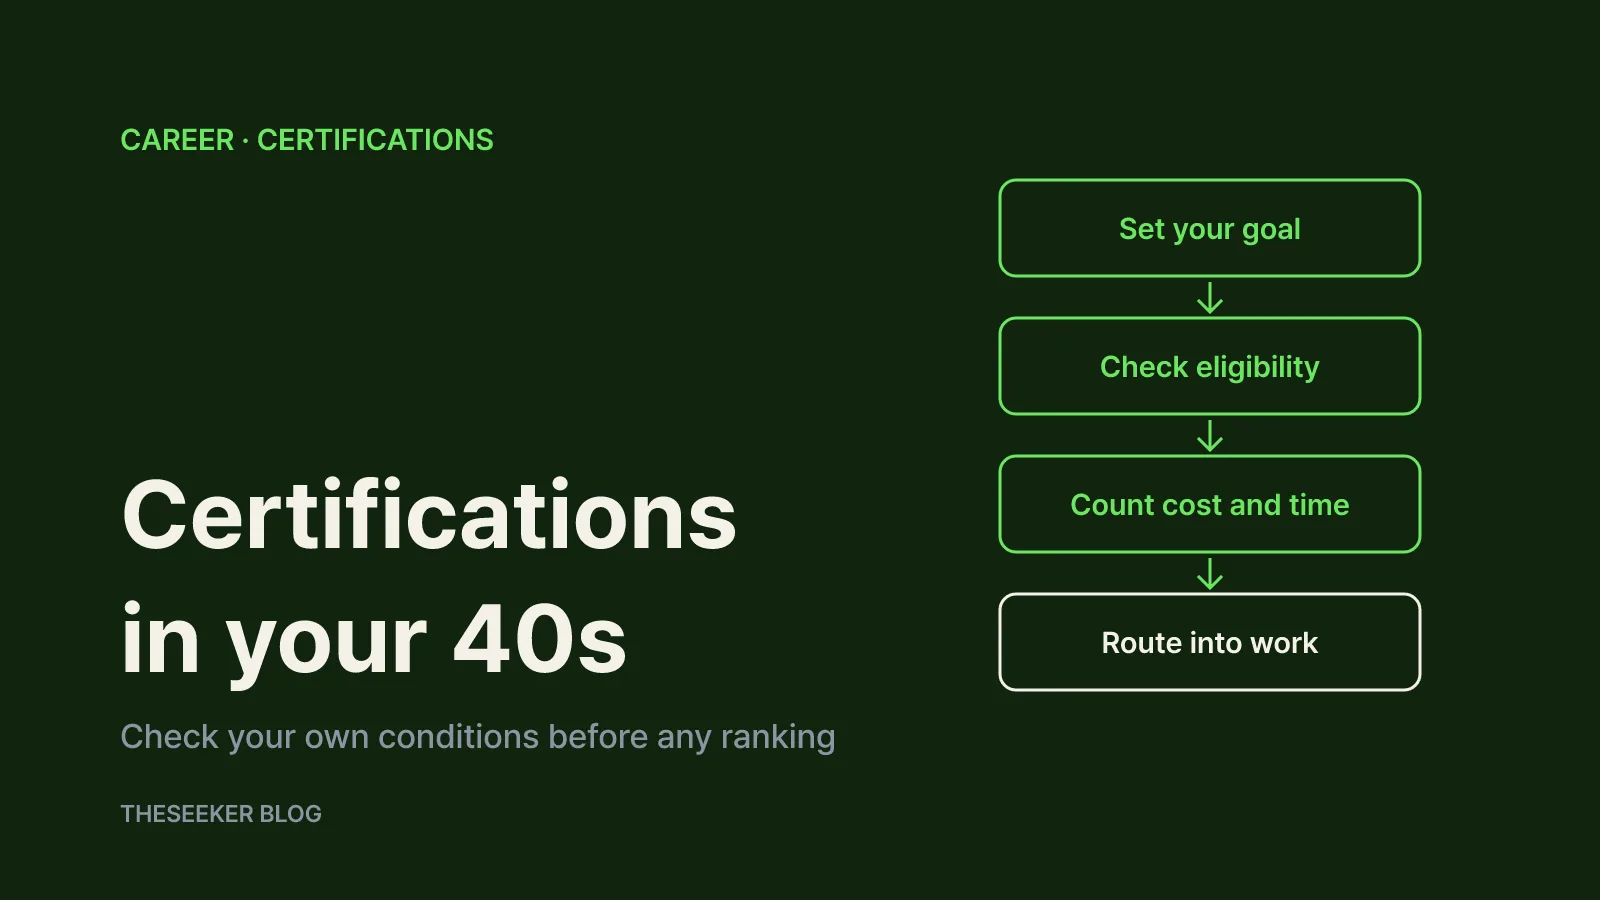
Once you can verify someone else's list, build one around your own situation. Official statistics tell you how many people sit an exam and how many pass. They do not tell you whether you need that qualification.
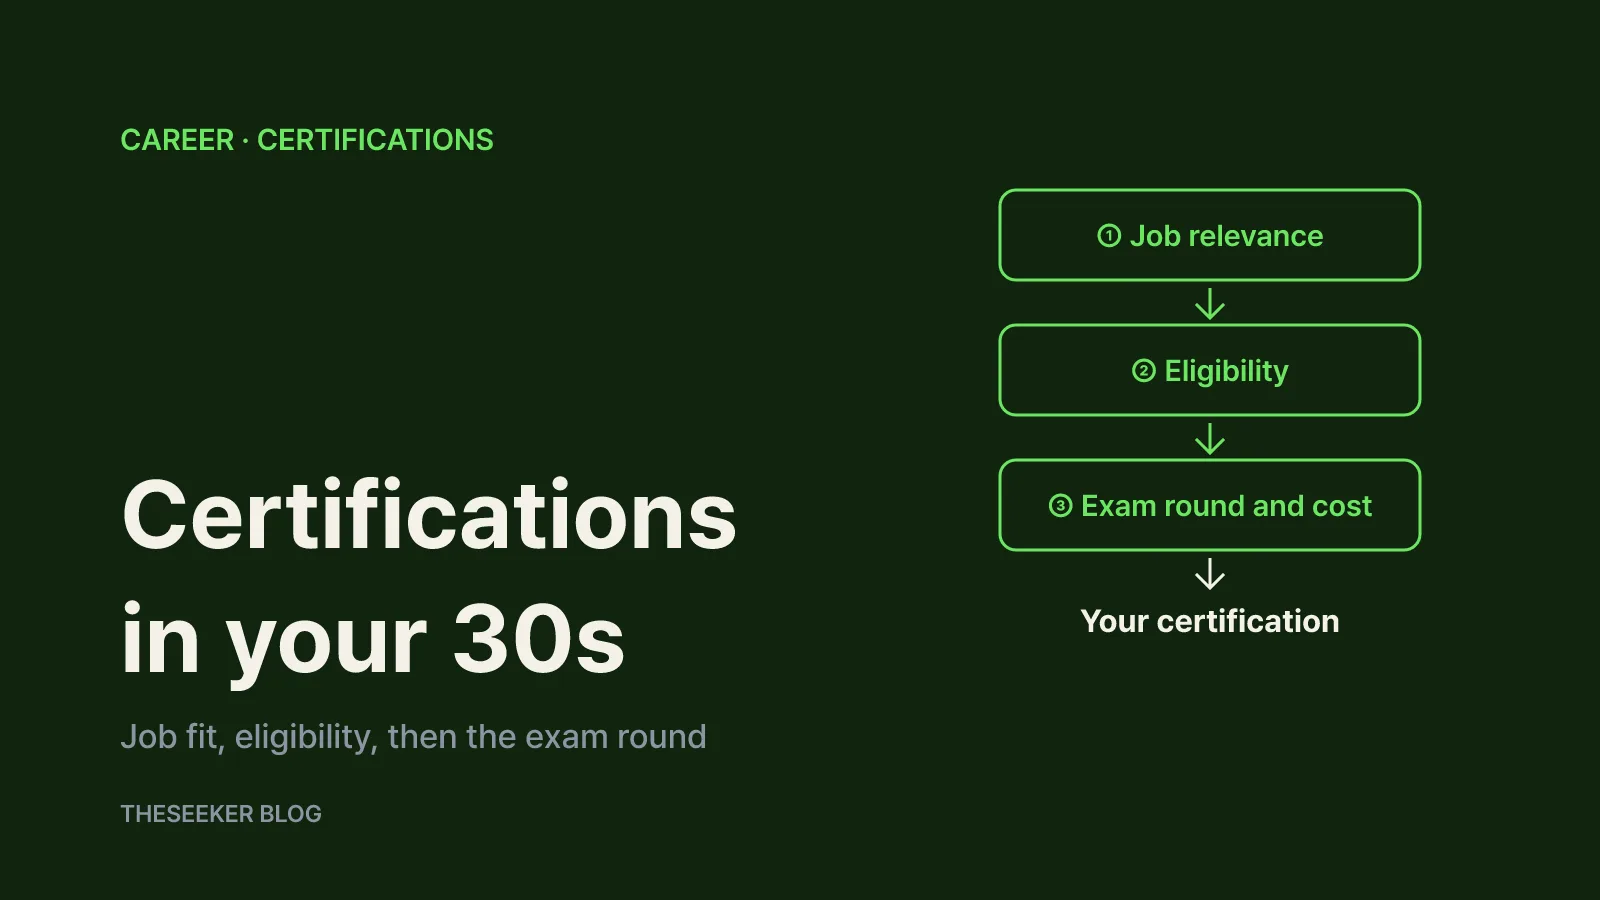
- Start from your target roles. Collect the qualifications that job postings in your field list as required or preferred. Starting from postings rather than a ranking narrows the field quickly.
- Open the Q-Net table for each candidate. Copy three to five recent years of written and practical applicants and pass rates into one sheet.
- Mark the narrow gate. Note whether the written or the practical stage has the lower pass rate and plan your study time accordingly.
- Confirm eligibility and dates separately. Use the issuing body's own pages, such as Q-Net's eligibility self-check and annual exam schedule, and treat dates in rankings or reviews as hints only.
- Record the date you checked. Figures are updated every year, and the yearbook notes that later changes can be reflected in the following edition. Label your sheet with the month and year you checked Q-Net.
A comparison built this way looks plainer than a viral ranking, but you know exactly where every number came from and what it measures. Use rankings to discover options, and make the decision with the source data and your own goals.
Sources
Frequently asked questions
Where can I find official pass rates for Korean national technical qualifications?
On Q-Net, open the qualification under National qualifications → Details by qualification, then scroll to the examination statistics table on the Basic information page. It lists written and practical applicants, passes and pass rates by year. For many qualifications at once, use the Qualification statistics menu, which includes the summary pages and the Statistical Yearbook.
Does a low pass rate always mean a harder certification?
No. A pass rate mixes exam difficulty with how prepared candidates are, and written and practical stages can differ sharply. Engineer Information Processing, for example, had a 65% written and a 22.1% practical pass rate in 2025. Look at each stage separately and across several years.
Why can more people sit the practical exam than the written exam?
Practical candidates can include people who passed the written exam in an earlier session and are exempt from retaking it. In 2025, 73,858 people sat the Engineer Information Processing practical exam compared with 66,308 for the written exam. Check Q-Net's written-exam exemption page for the exact rules.
Is a certification with many applicants better for getting a job?
Not necessarily. Applicant numbers show how many people take an exam, not how employers in a specific role value it. Check which qualifications your target job postings require or prefer, then compare applicant numbers and pass rates within that shortlist.
blog.theseeker.io/en/posts/certification-rankings-pass-rate-data-check
Hannah Price
Hannah covers job searching, the workplace and preparing for professional exams, confirming dates and requirements against notices from the bodies that run them.
Read our editorial standards